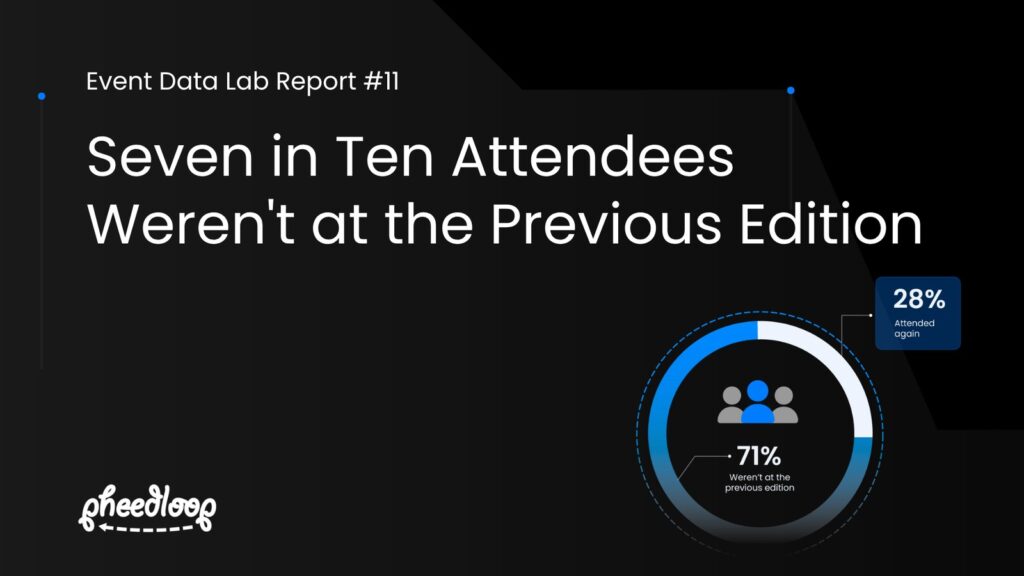
Around seven in ten people at a recurring event were not at its previous edition, according to new research from PheedLoop. Its Event Data Lab Report #11, published on 5 November 2026, matched attendees across 556 pairs of consecutive editions run on the platform and found a median of 71% of each edition’s audience was new. Only 28% of the people at one edition came to the next. This report is based on PheedLoop’s published findings; we have not seen the underlying data.
What the report measured
PheedLoop compared registration lists for consecutive editions of the same event, run by 260 organisations on its platform between January 2023 and October 2026. According to the report, the dataset covers:
- 556 consecutive edition pairs, with more than 330,000 attendees at the earlier edition of each pair
- 194 chains of three consecutive editions, across 120 organisations
- pairs where both editions had at least 100 completed registrations, with test, sandbox and internal events excluded and cancelled registrations and add-on purchases removed
Returning attendees were matched on email address. PheedLoop points out that this makes its return rates a lower bound, because someone who registers with a different address the following year counts as new.
The headline figures
The median return rate was 28%, with the middle half of edition pairs between 21% and 38%. Fewer than one pair in ten kept more than half of its audience.
The figure barely changed with event size or year, which is the most useful part of the finding for anyone benchmarking their own event:
| Group of edition pairs | Median share of attendees who returned |
|---|---|
| Earlier edition with 100 to 250 registrations | 28% |
| Earlier edition with 251 to 500 registrations | 28% |
| Earlier edition with 501 to 1,000 registrations | 30% |
| Earlier edition with more than 1,000 registrations | 30% |
| Editions held in 2024 | 27% |
| Editions held in 2025 | 28% |
| Editions held in 2026 | 29% |
| Events on a roughly annual cycle (330 to 400 days apart) | 30% |
| Events on other cadences | 23% |
PheedLoop says the pairs with return rates under 5% are mostly cohort programmes, multi-city series and other formats designed to reach a different audience each time, rather than events that are failing.
Second-time attendees come back at twice the rate
The three-edition chains show where retention is won or lost. Among people attending for the second year running, 51% came back for a third edition. Among first-timers, only 23% returned. Second-timers returned at the higher rate in every one of the 194 chains, by a median factor of 2.1.
Skipping a year and coming back was rare. Across three editions, 14% of the original audience attended all three, and only 7% missed the middle edition and returned for the third.
Two other patterns point the same way. At events that used both member and non-member registration categories, members returned at 37% and non-members at 18%. Where the earlier edition used check-in, attendees who actually turned up returned at 31%, against 20% for people who registered but did not check in.
What this means if you run a recurring event
If the pattern holds for your event, most of next year’s audience has to be found again, so acquisition is the main job rather than a top-up around a loyal core. PheedLoop’s own conclusion is that the leverage sits with first-timers: an event that turns a new attendee into a second-time visitor roughly doubles the odds of a third visit. It suggests treating first-year attendees as their own audience, with post-event communication, early-bird pricing and membership offers aimed at getting them back once.
You can check your own figure from two registration exports, matched on email address. A few points to keep in mind when you compare it with PheedLoop’s 28%:
- The benchmark comes from events run on one platform, so it reflects the kinds of events PheedLoop’s customers run. Trade shows, festivals and consumer events may behave differently.
- Email matching undercounts returners, so your own figure will be low for the same reason.
- Check-in data matters. If your registration platform records who actually attended, you can separate no-shows from attendees, which the report shows return at very different rates.
Registration platforms that record check-in and attendance history make this easier to measure. You can compare options in our registration and ticketing directory and our guide to choosing event registration software. For the check-in side, see the badging and lead retrieval directory.
Where to get the full report
The summary is free to read on PheedLoop’s blog, and a downloadable PDF adds benchmarks by event size, cadence and registration category, the three-edition analysis and methodology notes. It is part of PheedLoop’s Event Data Lab series, which has also looked at session attendance, late registration and how leads are spread across exhibitors (our comparison of lead retrieval and badge scanning covers that side). PheedLoop is also running a partner webinar on its event data on 24 November 2026.
Source: pheedloop.com